Wireless LoadCells: Difference between revisions
m A guide too configuring and logging with the load cell program |
No edit summary |
||
| (One intermediate revision by the same user not shown) | |||
| Line 12: | Line 12: | ||
[[File:Loadcell-remote.png|left|thumb]] | [[File:Loadcell-remote.png|left|thumb]] | ||
[[File:Load_cell_table_with_graph.PNG|left|thumb]] | |||
| Line 27: | Line 29: | ||
- Find the data tag on each load cell and enter them into the program under data Tag | - Find the data tag on each load cell and enter them into the program under data Tag | ||
Change the format to 0.000 | - Change the format to 0.000 | ||
Overload should be set to 5 | - Overload should be set to 5 | ||
There are various functions that can be put onto each channel but if you wish to just measure weight then you should select none | - There are various functions that can be put onto each channel but if you wish to just measure weight then you should select none | ||
Press ok and you have created your own work space you can save this by pressing File then ‘Save Workspace’ if you wish to use this workspace at a later date | - Press ok and you have created your own work space you can save this by pressing File then ‘Save Workspace’ if you wish to use this workspace at a later date | ||
| Line 46: | Line 48: | ||
Recording a Log: | Recording a Log: | ||
To record a log of the changes of weight on the load cell go to ‘Logging’ and click ‘Start Logging’ once you have finished recording click ‘Stop Logging’ | - To record a log of the changes of weight on the load cell go to ‘Logging’ and click ‘Start Logging’ once you have finished recording click ‘Stop Logging’ | ||
To view the log go to ‘View Last Log’ and it will open Microsoft Excel and you will have the data in front of you. You can change the logging interval on the ‘Configure workspace’ Page. | - To view the log go to ‘View Last Log’ and it will open Microsoft Excel and you will have the data in front of you. You can change the logging interval on the ‘Configure workspace’ Page. | ||
To form the data into a graph go to ‘Insert’ and then ‘Line’ and then chose a graph that suits your data | - To form the data into a graph go to ‘Insert’ and then ‘Line’ and then chose a graph that suits your data | ||
- Once the graph is up go to ‘Select Data’ then highlight the columns for each load cell your taking data from as well as the time while holding down the ctrl button. You should now have a line graph showing the changed in weight on the load cells. | - Once the graph is up go to ‘Select Data’ then highlight the columns for each load cell your taking data from as well as the time while holding down the ctrl button. You should now have a line graph showing the changed in weight on the load cells. | ||
Latest revision as of 15:54, 7 November 2012
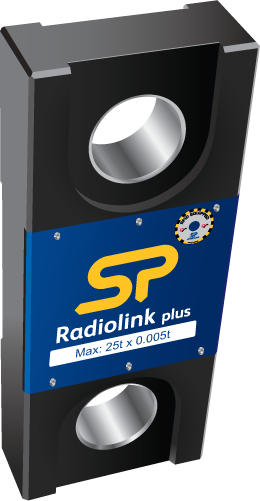
In September 2012 RCS bought 4 Straightpoint Wireless LoadCells
Manual Here

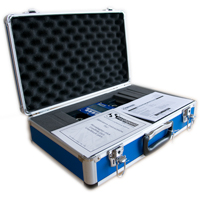
Each unit is contained within it's own carry case and has it's own remote


How to use load cells:
To use load cells first plug in the load cell base station and then open the load cell program .
Configuring your workspace:
- Go the the edit menu and click configure workspace
- Find the data tag on each load cell and enter them into the program under data Tag
- Change the format to 0.000
- Overload should be set to 5
- There are various functions that can be put onto each channel but if you wish to just measure weight then you should select none
- Press ok and you have created your own work space you can save this by pressing File then ‘Save Workspace’ if you wish to use this workspace at a later date
Taking a Measurement:
To see the current weight on your load cells go to the ‘Sleep & Wake’ Menu and press wake You will now see the weight on each cell displayed on the counters
Recording a Log:
- To record a log of the changes of weight on the load cell go to ‘Logging’ and click ‘Start Logging’ once you have finished recording click ‘Stop Logging’
- To view the log go to ‘View Last Log’ and it will open Microsoft Excel and you will have the data in front of you. You can change the logging interval on the ‘Configure workspace’ Page.
- To form the data into a graph go to ‘Insert’ and then ‘Line’ and then chose a graph that suits your data
- Once the graph is up go to ‘Select Data’ then highlight the columns for each load cell your taking data from as well as the time while holding down the ctrl button. You should now have a line graph showing the changed in weight on the load cells.